The task:
It needs perform testing of Web server to discover memory leaks.
The solution:
- Create LoadRunner VuGen script for your application (Web server in my script)
Let's suppose, we have done it:
Actually, I will explain different tricks and features of VuGen scripts in the further posts. - Create LoadRunner Controller scenario for your application using the VuGen scripts.
Here it is:
- The next step is to add measurement monitors which are quantitative indicators of resources being monitored (for example, memory usage, CPU usage, handle and thread count, and so on).
For that, on "Run" tab in the LoadRunner Controller, drag "Windows Resources" item from the "Available Graphs" tree and drop it to graphs area.
See the screenshot:
Then right-click on the just added graph ("Windows Resources") and select "Add Measurements" from the pop-up menu.
"Windows Resources" dialog will be shown: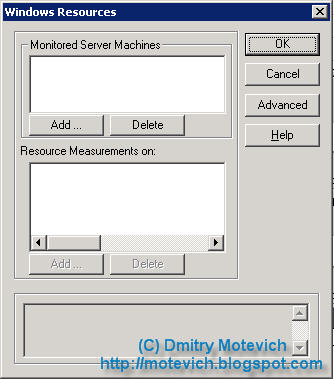
The following actions are easy. I will add the name of server where the application (Web server in my case) will be run. This server can be a remote one. In this case, you have to make sure that LoadRunner will have an access to get info from the remote computer. Usually, I provide administrator rights for user which executes LR scripts.
After that I select counters I want to measure during the load testing: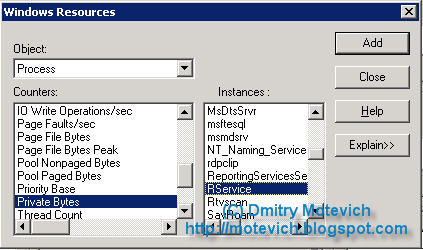
So, "Windows Resources" dialog looks like:
I selected the following counters:- % User Time for two processes (RService & tomcat5) and the whole system (_Total)
- Available bytes in the system
- Handle counts
- Thread counts
- Working Sets
Pay attention... If you select the "Windows Resources" graph, the list of counters will be shown in the lower part of the LoadRunner Controller: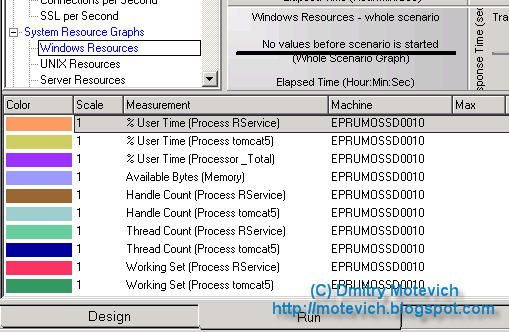
- Our mission is almost complete :) We have to run the scenario against a number of concurrent users (I user 30 users) and observe the graph displaying info on memory, CPU, handles and so on...
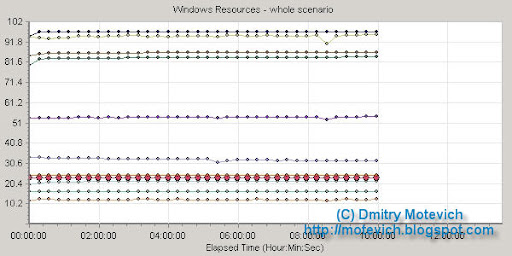
I will show the result graph after 4 hrs of execution: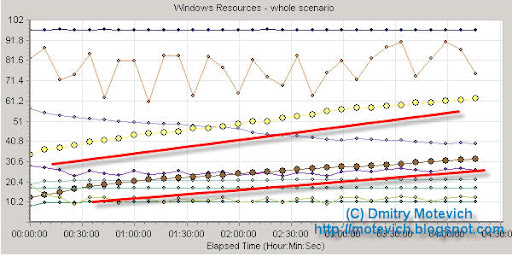
Pay attention to the yellow dotted line (memory usage of "RService" process) and the brown dotted line (habdle count counsumed by "RService" process) trends. They grow constantly during ~ 4.5 hours. I marked them out with red lines.
So, this graph provides proofs that the application, I tested, contains memory leaks in the "RService" process.
Several words about useful tricks and hints, connected to measurements ans graphs:- It is possible to export graphs to HTML from the LR. For that, right-click on the graph and select "Export to HTML...". It will generate HTML report containing the graph and a legenda for it. Very useful feature :)
- I recommend to set the range of time to be shown on the graph, to "Relative to scenario start". To perform this, right-click on the graph and select "Configure...". That allow to display statistics for the whole execution, but the latest N minutes.
- Sometimes, it is convenient to show more detailed graph. For that, double click on the graph - one big graph will be shown. To revert, double-click again. Also, you can change the number of graphs displayed - open menu View/View Graphs and set the required number.
- So, now Dev team has to fix the problem in the "RService" process.. The last graph shows the results of load testing perfomed on the fixed application:
No any memory leaks found during 10 hrs.
Memory leaks fixed! Isn't it a progress? :)


I hope, my explanation will be helpfull for you :)
Please, share your comments and thoughts. Ideas for further topics - welcome :)
Do you like this LoadRunner visual tutorial? Would you like to receive them in the future?
If yes, please subscribe to this blog RSS feed or by Email. (How to subscribe? VIDEO guide)
Dmitry Motevich,
QA / Automated testing specialist
Excellent work
ReplyDeleteGreat work, Dima.
ReplyDeleteThe best thing is that Dima has done this in real, no "theoritizing" and stuff like - the real work was done and was done pretty good!
Hey thanks for this. This is very good work. This is real and makes understanding this bottleneck more easy and reliastic.
ReplyDeleteThanks again.
YZS
Excellent post. Hands-on and very effective. Keep up the good work and keep the posts coming!
ReplyDeleteHere I want to say some thing...
ReplyDelete"This is real work to real people in the real testing world".
Thanks for your knowledge sharing with people. Good work... we hope that we get more articles from you...
As I wrote: Ideas for further topics - welcome :)
ReplyDeleteSo, if you have some problems in LoadRunner, which should be explained, please let me know... I hope, I will be able to help you :)
Your knowledge is commendable.The way you explain the concepts is superb. I have a doubt regarding the runtime settings.Can you please tell me the best runtime settings and why to use those settings.Difference in using the rutime settings..For example Run user as a process, run user as a thread..what difference does it make.
ReplyDeleteThanks a lot..Naga
2Anonymous,I promise, that i will describe LoadRunner Run-time settings in details in the future. I've just added this topic to my TODO list.
ReplyDeletePlease, track my blog and you will find the answer.
And thank you for your nice opinion about my blog :)
You are the greatest.
ReplyDelete2Anshoo:
ReplyDeleteI think, you didn't see great guys :)
In any case, thank you for your opinion :)
Dear dmirty,
ReplyDeleteGreat explanation. I have one query
"How to findout memory leaks if the application is deployed on Unix machine?". The problem we are facing is unable to Monitor Weblogic10 from LR 8.1, which is deployed on Unix machine.
Thanks in advance.
Regards,
Param.
2Param:
ReplyDeleteI didn't work with Weblogic10.
Though, I found the answer for your question. Please, read Mercury Knowledge Base - ID: 11909 (How to set up the WebLogic monitor).
This article contains attached documents, describing Weblogic10 monitoring in details.
It works only until Weblogic 8.x.
ReplyDeleteany how, Thanks for giving reference.
Regards,
Param
such a nice work u have shown to us that i want to say thank to u for ur gud explainatary example with real work.plz provide more info on other important topics/features of loadrunner
ReplyDeleteExcellent work.
ReplyDeleteI am very much thank full to you for good explanation for memory leak
Hi Dima,
ReplyDeleteAwesome work!!
One request from me. Can you please give us an article which describles in details about the analysis. How we have to analyze the results? What are the possible or most frequest results for web or client/server application. How we have to explain the client about the results and suggestions to the dev team.
Awaiting your response.
Dmitry Motevich your works are very good & helped me lot, i had a small query, in a web application i created a data file & a link will be displayed containing the file name & date & time to open it. The application takes few seconds to minutes depending on the file size to create the file. but during load test the vusers are trying to open the file regard less weather it is created or not & display error if it is not created, how to code to solve the problem? please help
ReplyDeleteSir,,,,u have done amazing work by putting all the important information about LoadRunner and Sharing your experience with us guys who are new in loadRunner or who are using LoadRunner from a long time now,,,,,Thank you very much for such a good work,,,,Please keep us posted with more.......!!
ReplyDeleteHi,
ReplyDeleteThanks for the post. i hope that we get more articles from you....
Good work. I have a question in having a real time load test. I mean I'd like to control the load in the controller (say 15 users first 2 hours, 50 users next 3 hours and 20 users next 2 hours) Any ideas on how to acheive this through controller?
ReplyDeleteHi Dimity,
ReplyDeleteThis is an amazing post on "How to detect memory leaks with LoadRunner - visual tutorial". It really help me a lot.
Can you provide me info. on QTP Automation Frame work.
What is it, what are all involved in the frame work etc....
Raja
Can some one suggest how to pinpoint bottlenects on front-end application system and the database through the diagnostics monitoring of the LoadRunner.
ReplyDelete2Anonymous (about different numbers of users).
ReplyDeleteYou can user several LoadRunner scenario groups. You can specify schedule options by groups - for example:
- first scenario group will run 15 users during 2 hours;
- second scenario group will run 50 users during 3 hours;
- third scenario group will run 20 users during 2 hours
After that specify to run these group one after one and you will get what you asked!
Hi,
ReplyDeleteCan we debug a script from LoadRunner Controller itself.
Raja
2Raja:
ReplyDeleteNo, it's impossible to debug LoadRunner script in Controller. You can write messages to output log only.
If you plan to debug, use VU Generator for that.
Hi Dimitry,
ReplyDeleteThanks a lot for all your answers and the information provided in this site, these are really helpful for me and even for others also.
I dont have any experience on analyais part.
Can you please provide me any information on analysis part, few things we need to focuss intially on analysis after the controller part. What are the basic graphs and reports we need to consider.
Raja
x for such a good article..hey can you please throw somw light on how to find performance bottlenecks. plz.thx
ReplyDeleteHi dimirty,
ReplyDeletegood explanation....
But can u tell me what is "RService" process and habdle count.
Thanks
Thambi
Hi Dimitry,
ReplyDeleteHave you ever used MQSeries Protocol for recording the MQ Transactions between a server and mainframe? If you have any idea about the approach and basic things required it would be great. Going through your blogs I feel that you are much of a hands on person and that is why I seek your assistance.
2 Anonymous:
ReplyDelete"RService" process is a part of our sofware, which was monotored.
Handle count - is a number of handles, used by a process.
I am unable to find any site to download LoadRunner other that HP.
ReplyDeleteUsing HP link I am not allowed to download LoadRunner in my company as it is in ISO format.
Can you please provide any other link to download LoadRunner.
If possible please send the link to rajasekhar.nirmala@gmail.com
How to handle "Security alerts" when creating scripts for web application.
ReplyDeleteFor Ex:
I have login to a some web page, I had got "security alert". how to handle this.
If possible also please send the answer to rajasekhar.nirmala@gmail.com
2Anonymous:
ReplyDeleteThe only place where you download LoadRunner is HP site.
If you faced some problems with downloading, please contact HP sales persons.
I'm sure, they will help you and provide trial LoadRunner.
2Anonymous:
ReplyDeleteWhat site did you record when you get "Security alerts"?
Hi,
ReplyDeleteCould you please instruct me where to input Administrator information (user name/password) when entering Remote Server Name?
2Anonymous:
ReplyDeletePlease clarify...
What Administrator information do you mean?
And what is Remote Server Name?
Hi,
ReplyDeleteThanks for the detailed explanation.
Can you please include more topics on Bottleneck identification and analysis from Loadrunner monitors.
Thanks,
Happy
Hi Dima,
ReplyDeleteIt is a very good expalnation on memory leaks. I am enjoying the tutorial of you practically by implementing. Are ou planning to have any skype session on loadRunner, If so could you please let us know we will arrange all the necessary things like meeting set up and etc.
Thanks,
www.loadtestplus.blogspot.com
loadtestplus (from September 1),
ReplyDeleteI do not plan to provide free Skype consultations...
At least, for the nearest time.
I would spend my energies and time on others activities :)
good explanation on memory leaks detection
ReplyDeleteHi Dmitry,
ReplyDeleteThis is really excellent. And thank you. I have a question, if my web server is MS IIS, are the counters going to be same as the counters you have used? If not what would you select? Also are you planning on to publish any more article over memory leaks?
Once again thank you in advance.
@Chapal,
ReplyDeleteIt depends on what are you going to measure :)
I don't have info about your application. That's why I cannot answer.
this tutorial very good. I am having one query something related to same.
ReplyDeleteActually I wanted to check memory leaks but the problem I have is like:
There is one box(server) in which I have to login first and then to another server where my actual application(to be tested) is running. So how can I do this memory leak test for 2nd server. I am running LR from outside 1st server so I can easily use this method for 1st server but I have to test memory leak for 2st server . So can any one suggest how should I perform this. It would be really great.
Hi dmitry,i am using weblogic as application server how can we find out the issues in weblogic based on counters?
ReplyDeletefor ex: how can we find out the memory issues with weblogic?
i will waait for u r answer
thanks
sridhar
Do u have brief information on LR Analysis? if so please explain topics on LR analysis.
ReplyDeletethe people who are working on LR will be always thankful to you.
Thanks & Regards
Sridhar
Hi Dmitry..
ReplyDeleteFirst , thanks for your post.. They are very informative, cover common problems, and give a easy and practicle solution to them.
However, I was wondering if you can write a couple of posts about Diagnostics (Installation, usage, interpretation)? Would be really great.. Looking forward to your reply..
Hi dmitry,
ReplyDeleteFirst let me thank you for the invaluable posts that you have published.
I have executed some LR scenarios to measure the page load time for an intranet application created in SharePoint. What i have found in the result was that the page load time for some of the pages are less than 2 seconds (transaction time). But when i test the application manually without any user load i have noticed that the page load time should be more than that. That is there is a significant delay in loading a page. How to simulate the actual page load time in this case?
Hi Dmitry,
ReplyDeleteThis site is really helpful and excellent. I'm requesting you...
Please post the one sample project from beginning to ending. And also explain... how to calculate the performance.
Hopefully awaiting...
thanks advance.
@@Ankur (January 12, 2009),
ReplyDeleteI do not plan to create tutorials about LR Diagnostics in the nearest future.
@JDB1981 (January 14, 2009),
ReplyDeleteYou should understand the difference between load testing (=LR) and functional testing (=manual running).
LR does not perform client activities. In other words, LR does not create new browser, does not allocate memory for it, does not paint UI controls, does not process user input, etc.
LR just sends traffic to a server and gets its response. Network operations do not require much resources (CPU, memory, etc).
When you open URL in a browser manually, new instance of a browser is being created, browser creates and paints UI controls, it reacts to user input (keyboard & mouse), etc.
Also, please pay attention, that speed the depends on the client computer. The powerfull computer, the quicker response. So, it is difficult to say what response is 'normal'.
Well, How to emulate real users?
I recommend to record your script with lr_think_time function. Also, you can add them manually.
lr_think_time function performs a delay in a running of script. Using it, you can 'speen down' your scripts.
Dear Readers!
ReplyDeleteThank you very much for you comments!
Since this article was published more than one year ago, I've just disabled an adding of new comments for the article.